DICOM Image Segmentation - Flood Fill
 DICOM Image Segmentation - Flood Fill
In other examples you can see how to display a filtered image by toggling between the original and filtered images or by displaying (parts of) both original and filtered images simultaneously using an "image wipe" filter. In those examples the output of the filter is a modified version of the original data, with the same data type and value range as the original.
Display:
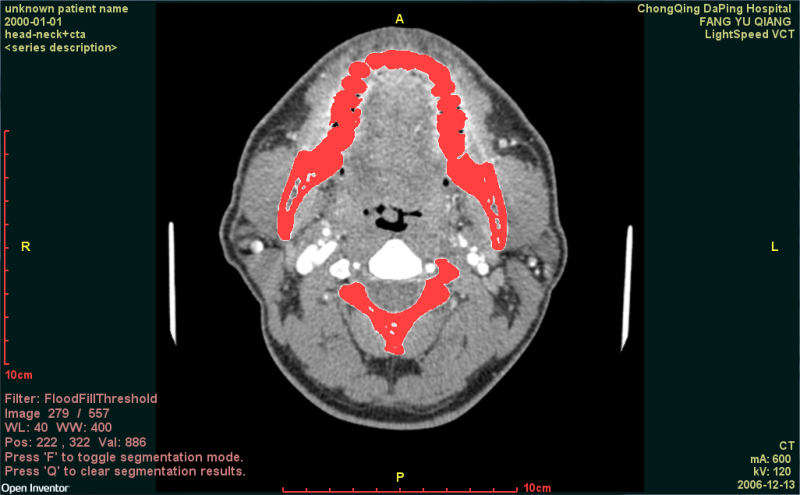
In this example the output of the flood fill filter is a "binary" image consisting of 0's and 1's. The filter has set the voxels selected by the segmentation operation (if any) to 1. This actually makes it easier to display the fesult of the filter operation. If we arrange for the 0 voxels to be completely transparent and the 1 voxels to be opaque (or translucent), then we can simply display the segmentation result "on top of" the original image as a sort of overlay. "On top of" in computer graphics terms really means "closer to the camera". So we need to be careful where we position the SoOrthoSlice that renders the filter output. We'll still use an SoSwitch node, but in this case the whichChild field will be set to 0 to display only the original data or set to -3 to display both original and filtered data.
Uses:
- SoGetPlaneFromVolumeProcessing3d to extract the slice of interest.
- SoFloodFillThresholdProcessing to create a binary image from a seed point and threshold range.
- SoAddObjectToLabelProcessing to accumulate the binary images (segmented patchs) from running FloodFill into a label volume.
Mouse buttons
-
In Selection mode (the default):
- No buttons: Voxel position and value are displayed as mouse moves.
- Button 1: Image number changes as mouse moves up and down.
- Button 2: Window level and width change as mouse moves.
- Wheel: Changes image number.
-
In Viewing mode (press ESC to toggle):
- Button 1: Zoom in and out as mouse moves.
- Button 2: Pan image as mouse moves.
- Wheel : Zoom
Hot keys:
- F: Toggle between original and filtered image.
- R: Reset window level and width.
- H: Reset pan and zoom (default view).
- Q: Reset segmentation buffer (erase all segmentation).
FILES:
- Medical/Segmentation/medicalImageSegmentationFloodFill/imageSegmentationFloodFill.cxx
SEE ALSO
SoVolumeData, SoDataRange, SoOrthoSlice
SCREENSHOT: