// tutorialMesh03.cxx
...
void
read_mesh( int* nx, float*& x, int* ny, float*& y )
{
FILE* f;
int i, j, n;
float c;
f = fopen( "mesh2D.geo", "r" );
if ( f == NULL )
exit( -1 );
fscanf( f, "%d%d", nx, ny );
x = ( float* )malloc( nx * ny * sizeof( float ) );
y = ( float* )malloc( nx * ny * sizeof( float ) );
for ( i = 0, n = 0; i < *nx; i++ )
{
fscanf( f, "%f", &c );
for ( j = 0; j < *ny; j++, n++ )
x[n] = c;
}
for ( j = 0; j < *ny; j++ )
{
n = j;
fscanf( f, "%f", &c );
for ( i = 0; i < *nx; i++, n += *ny )
y[n] = c;
}
}
void
read_val( int nv, float*\* val, float* vmin, float* vmax )
{
FILE* f;
float c;
f = fopen( "mesh2D.dat", "r" );
if ( f == NULL )
exit( -1 );
*vmin = 1E30;
*vmax = -1E30;
float* v = ( float* )malloc( nv * sizeof( float ) );
for ( int i = 0; i < nv; i++ )
{
fscanf( f, "%f", &c );
v[i] = c;
if (\* vmin > c )
*vmin = c;
if (\* vmax < c )
*vmax = c;
}
*val = v;
}
int
main( int, char*\* argv )
{
// Initialize Inventor and Xt
Widget myWindow = SoXt::init( argv[0] );
if ( myWindow == NULL )
exit( 1 );
// Initialize the new nodes class
PoMeshViz::init();
// Read back from file mesh data and geometry
int numX, numY;
float *xm,\*ym,\*vm, vmin, vmax;
read_mesh( &numX, xm, &numY, ym );
read_val( numX\* numY, &vm, &vmin, &vmax );
// Define data mapping
SbColor colors[5] = { SbColor( 0, 0, 1 ), SbColor( 0, 1, 1 ), SbColor( 0, 1, 0 ), SbColor( 1, 1, 0 ), SbColor( 1, 0, 0 ) };
float val[5];
val[0] = vmin;
for ( int i = 1; i < 5; i++ )
val[i] = val[i - 1] + ( vmax - vmin ) / 4.;
PoNonLinearDataMapping2* myDataMapping = New PoNonLinearDataMapping2;
myDataMapping->type = PoNonLinearDataMapping2::LINEAR_PER_LEVEL;
myDataMapping->value.setValues( 0, 5, val );
myDataMapping->color.setValues( 0, 5, colors );
// Define the list of isovalues
PoIsovaluesList* myIsovaluesList = new PoIsovaluesList;
// Initialize the mesh
myIsovaluesList->setRegularIsoList( vmin, vmax, 16 );
PoCartesianGrid2D* mesh = new PoCartesianGrid2D;
mesh->setGeometry( numX, numY, xm, ym );
mesh->addvalueSet( 0, vm );
// Create legend node
PoNonLinearValueLegend1* myLegend = new PoNonLinearValueLegend1( SbVec2f( -1, 1 ), SbVec2f( -.5, -.5 ) );
myLegend->set( "backgroundApp.material", "diffuseColor .4 .4 .4" );
SoAnnotation* legendAnnot = new SoAnnotation;
legendAnnot->addChild( myLegend );
// Create the solid contour visualization node.
PoMeshFilled* myfill = new PoMeshFilled;
myFill->valuesIndex.setValue( 0 );
myFill->zValuesIndex.setValue( 0 );
myFill->coloringType = PoMesh::COLOR_CONTOURING;
SoPerspectiveCamera* myCamera = new SoPerspectiveCamera;
// Create the root of our scene graph
SoSeparator* root = new SoSeparator;
root->ref();
root->addChild( mesh );
root->addChild( myIsovaluesList );
root->addChild( myDataMapping );
root->addChild( legendAnnot );
root->addChild( myCamera );
root->addChild( myFill );
SoXtExaminerViewer* viewer = new SoXtExaminerViewer( myWindow );
viewer->setSceneGraph( root );
viewer->setBackgroundColor( SbColor( 1., 1., 1. ) );
viewer->show();
SoXt::show( myWindow );
SoXt::mainLoop();
return 0;
}

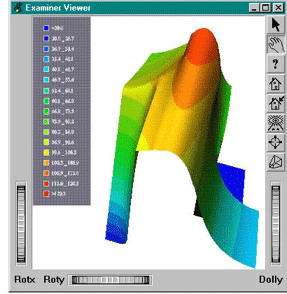 In the following example (located in $OIVHOME/src/MeshViz/Mentor), we will use a 2D Cartesian mesh, do a solid contouring on it, and add a legend to it. Notice the following steps: