Advanced Monitoring example.
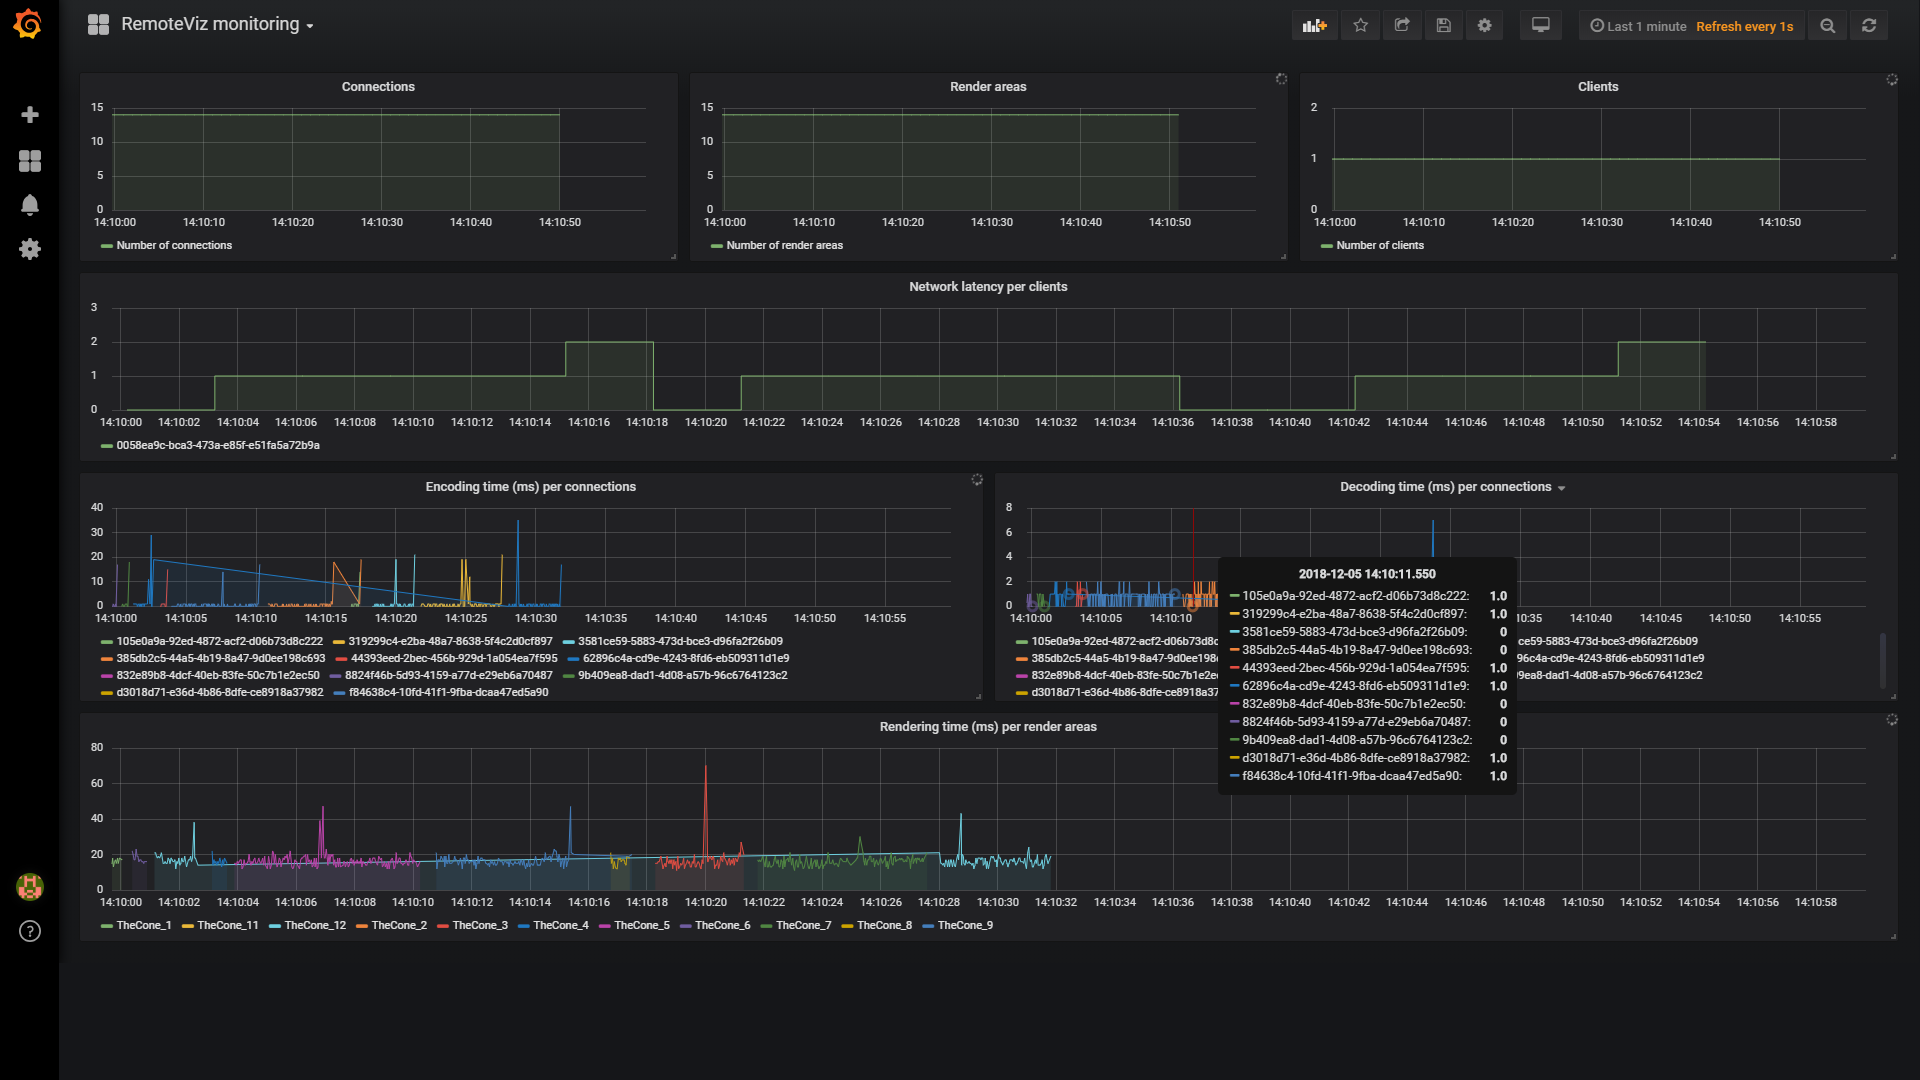
This example shows you how to monitor your RemoteViz service using tools like InfluxDB and Grafana.
Run the example:
- Go to "OIVHOME/examples/source/RemoteViz/Monitoring/MonitoringGrafana/DockerCompose" and follow the ReadMe file to start the Docker Compose service.
- Go to "OIVHOME/examples/bin/OIVARCH/RemoteViz" and run the executable "GrafanaMonitoredRenderingService".
- Go to "OIVHOME/examples/source/RemoteViz/Monitoring/Clients/HTML5" and open the "index.html" file inside a web browser.
Note: In this example, the RemoteViz service uses the localhost IP address (127.0.0.1) by default. To run it on a web server, start the example by passing the service IP address and port as arguments (ex : RemoteVizHelloConeRenderingService 192.168.0.1 8082) and edit the file "index.html" (client side) to modify the IP address and the port.
SCREENSHOT:
FILES:
-
RemoteViz/Monitoring/MonitoringGrafana/GrafanaMonitoredRenderingService/include/MonitoringMetricsListener.h
-
RemoteViz/Monitoring/MonitoringGrafana/GrafanaMonitoredRenderingService/src/MonitoringMetricsListener.cxx
-
RemoteViz/Monitoring/MonitoringGrafana/GrafanaMonitoredRenderingService/include/MonitoringServiceListener.h
-
RemoteViz/Monitoring/MonitoringGrafana/GrafanaMonitoredRenderingService/src/MonitoringServiceListener.cxx
-
RemoteViz/Monitoring/MonitoringGrafana/GrafanaMonitoredRenderingService/include/MetricsDispatcher.h
-
RemoteViz/Monitoring/MonitoringGrafana/GrafanaMonitoredRenderingService/src/MetricsDispatcher.cxx
-
RemoteViz/Monitoring/MonitoringGrafana/GrafanaMonitoredRenderingService/src/main.cxx
-
RemoteViz/Monitoring/Clients/HTML5/index.html