MIP
 Demonstrates the Min, Max and Average Intensity projection along with a slab rendering.
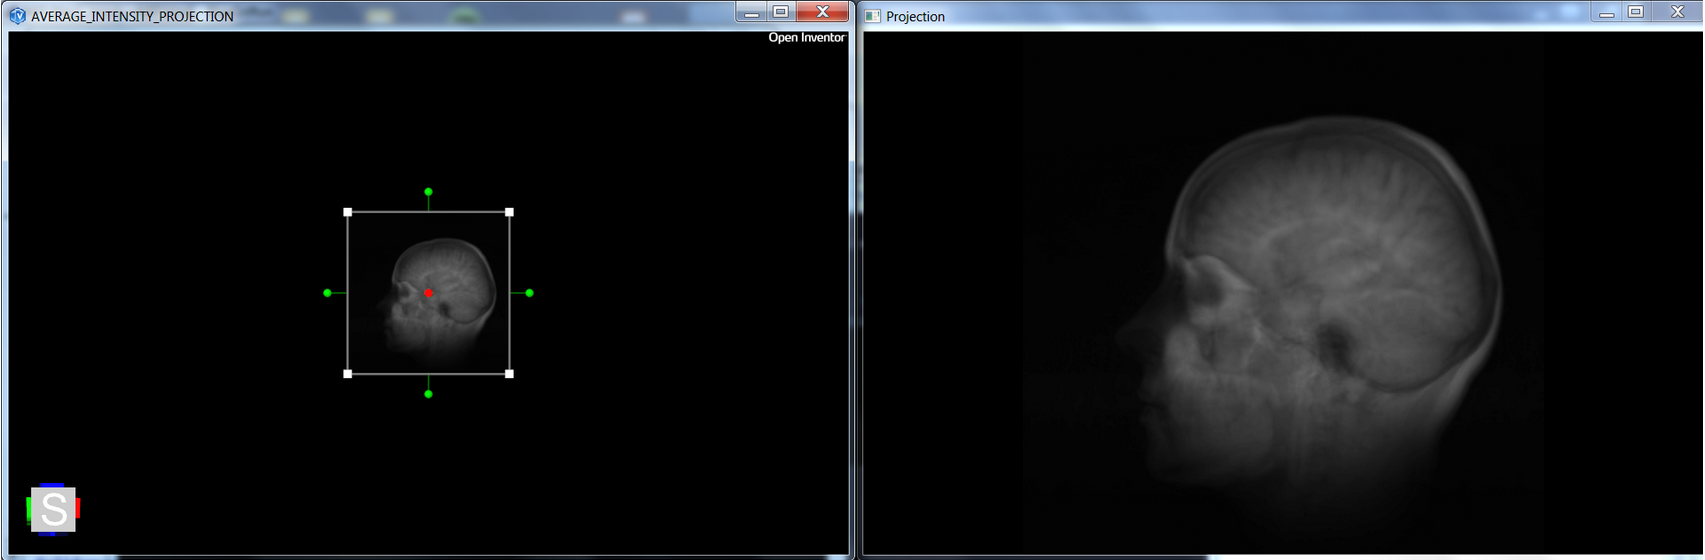
On the left is presented a 3D volume rendering of the data set that visually shows us the position, orientation and thickness of the slab that is being rendered in the right-hand window. The red arrow shows the direction of the projection. The lines, cubes and spheres visualized are part of a 3D interaction gadget in Open Inventor called a manipulator which allows us to directly manipulate a 3D box, which could be a region of interest or, in this case, a slab.
- Switch between the Min, Max and Average intensity projection by using the '+' key (In 3D viewer).
- Press the <SHIFT> key and select a white cube on the manipulator to scale the slab. ( More information in SoTransformerManip )
- Rotate the slab by selecting a green sphere on the manipulator. ( More information in SoTransformerManip )
FILES:
- Medical/Rendering/Visualization/medicalMIP/medicalMIP.cxx
SEE ALSO
SoVolumeData, SoTransferFunction, SoDataRange, SoVolumeClippingGroup, SoTransformerManip
SCREENSHOT: