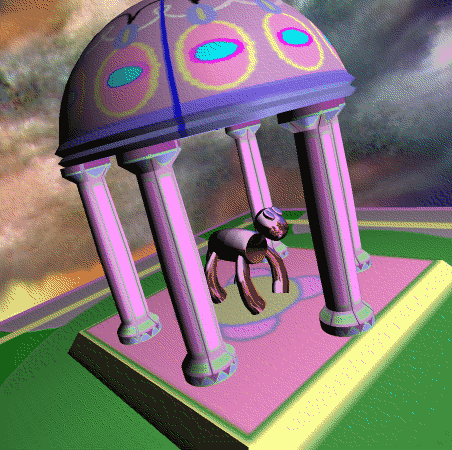
This section includes all of the color plates referenced throughout the book.
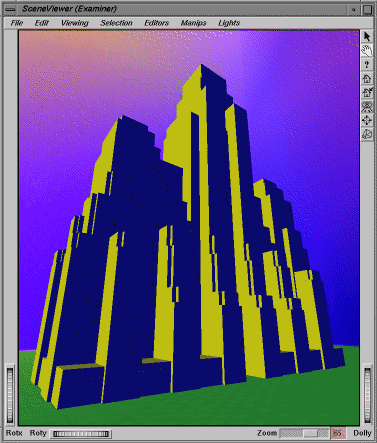
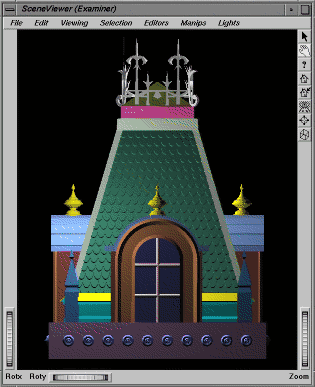
A scene showing the effects of directional lights. The scene contains blue and yellow directional lights; the building itself is white. (Images for Plates 1 through 21 by Paul Isaacs.)
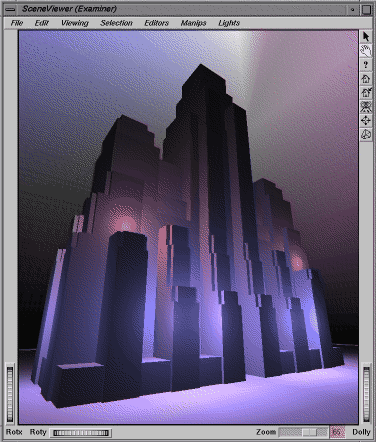
The same scene, using purple point lights.
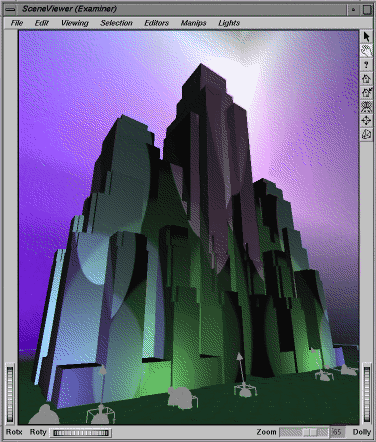
The same scene, using spotlights for a dramatic effect. Gray icons show the placement and orientation of the spotlights. See Chapter 4, Cameras and Lights.
Scene rendered with a lighting model of BASE_COLOR.
The same scene, with the lighting model changed to PHONG. See Chapter 5, Shapes, Properties, and Binding.
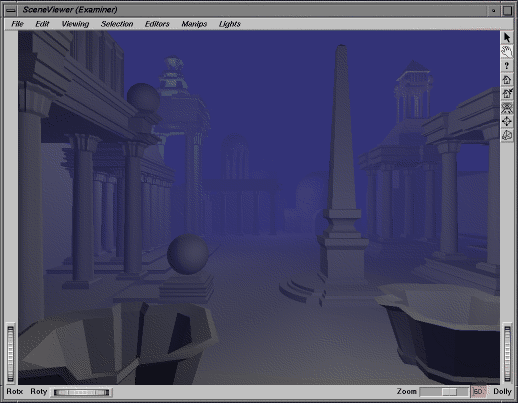
Scene showing the effects of an SoEnvironment node. The fog type is FOG, and the fog color is lavender. See Chapter 5, Shapes, Properties, and Binding.
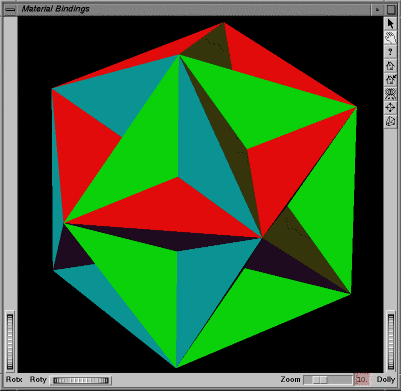
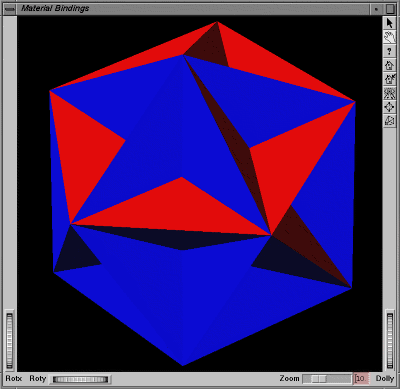
An indexed face set using per-face material binding.
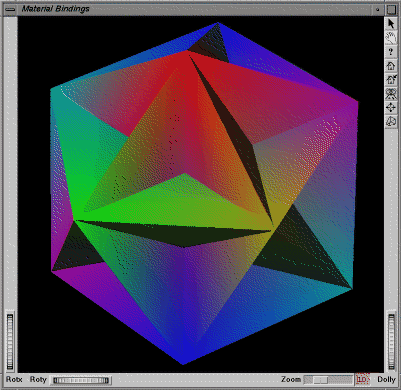
The same face set using per-vertex-indexed material binding.
The same face set using per-face-indexed material binding. See Chapter 5, Shapes, Properties, and Binding.
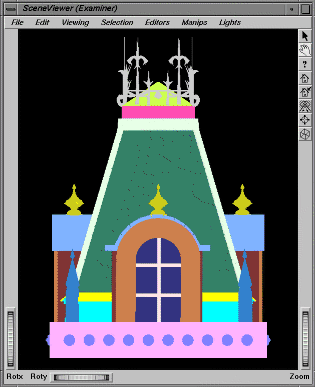
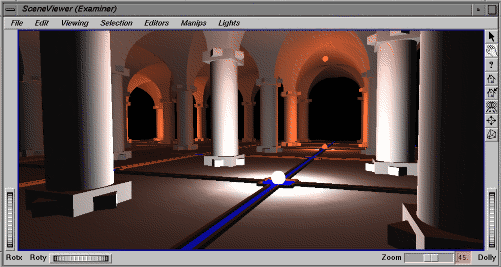
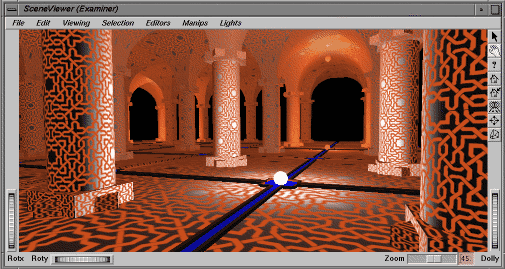
Scene using nontextured surfaces, a white point light in the foreground, and orange point lights in the background.
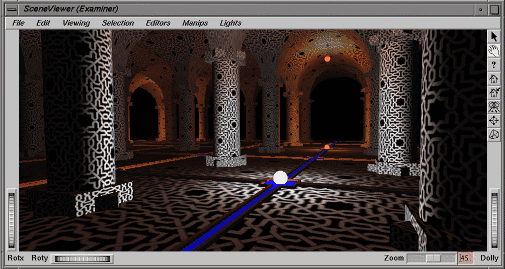
The same scene, with textures added using a MODULATE texture model.
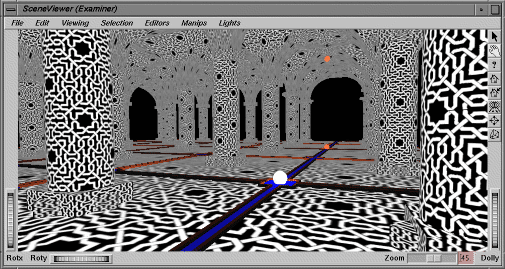
The same scene, using a DECAL texture model.
The same scene, using a BLEND texture model with a gold blend color to achieve a filigree effect. See Chapter 7, Textures.
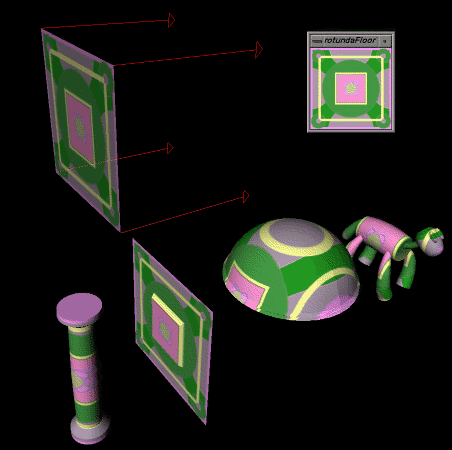
Texture mapping using SoTextureCoordinatePlane. The textured square at left (with arrows) is projected onto four different shapes.
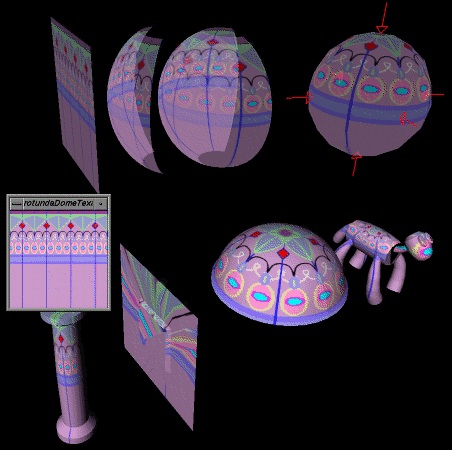
Texture mapping using SoTextureCoordinateSphere. The textured sphere at right (with arrows) is projected onto four different shapes.
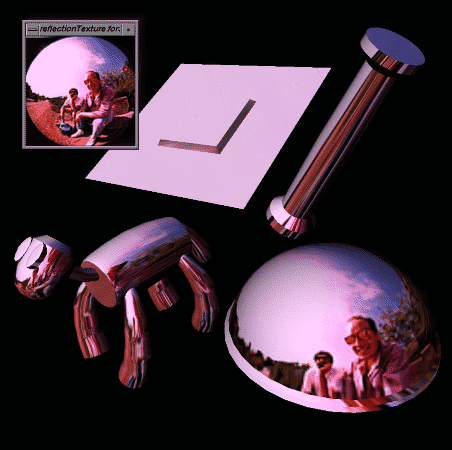
Texture mapping using SoTextureCoordinateEnvironment.
Scene using a variety of texture coordinate function nodes. See Chapter 7, Textures.
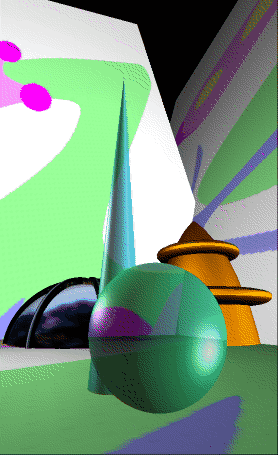
Scene using BLEND trans- parency type. The order of rendering is background, sphere, cone, black and gold buildings.
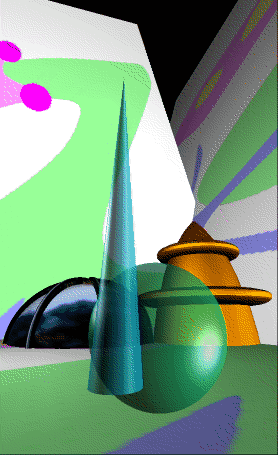
Scene using DELAYED_BLEND transparency type. Order of rendering is opaque objects (background, black and gold buildings), then transparent objects (sphere, cone).
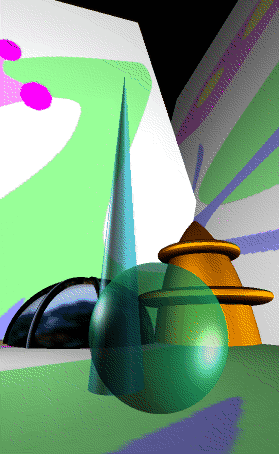
Scene using SORTED_OBJECT_BLEND transparency type. Order of rendering is opaque objects (background, black and gold buildings), then transparent objects, sorted from back to front (cone, sphere). See Chapter 8, Applying Actions.
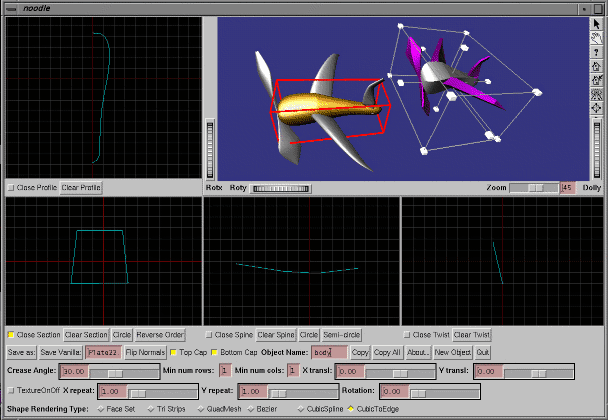
Noodle, an object modeler. The user specifies a cross-section, spline, profile, and twist for each object. The gold airplane is made of Inventor NURBS surfaces. The purple airplane is made of face sets using the same data.
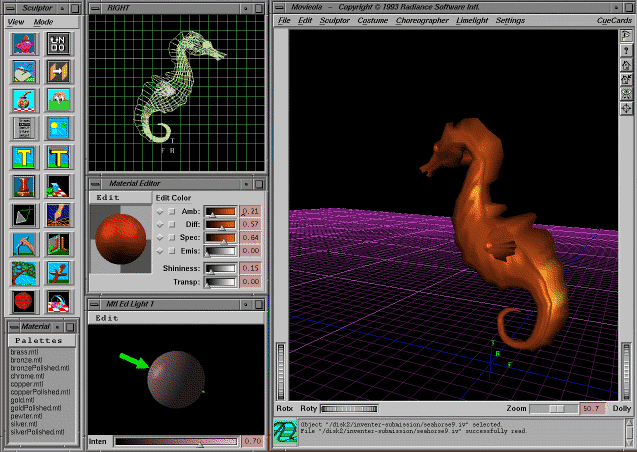
Movieola®, a modeling and animation system based on Inventor. This application makes extensive use of Inventor's 3D manipulators, components, and node kits to provide intuitive tools for creating complex shapes. (© 1993 Radiance Software International.)
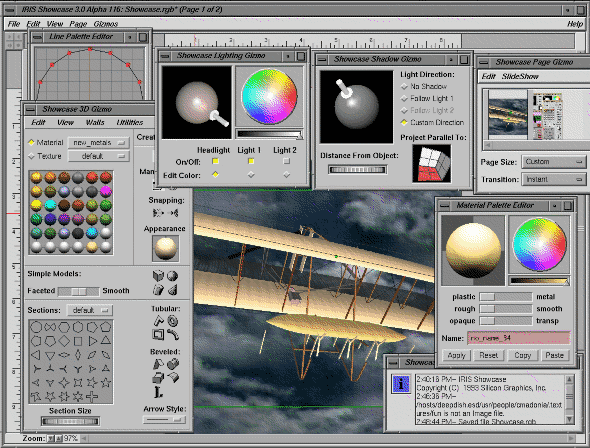
Showcase, an application for creating multimedia presentations. All 3D support, including rendering, interaction, and editing, is provided by Inventor. (Image by Rikk Carey.)
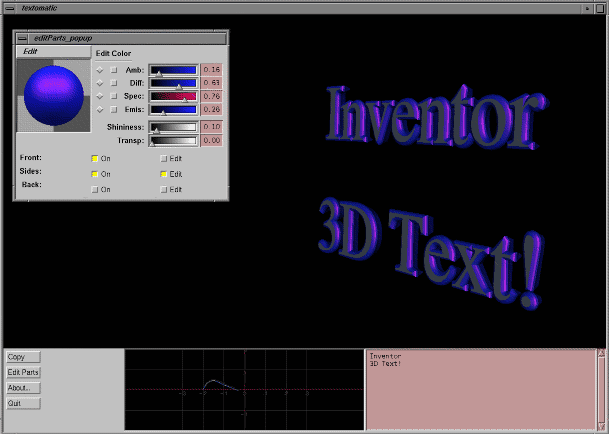
Textomatic, a simple Inventor application used for interactively defining profiles and materials for 3D text. (Image by Catherine Madonia.)
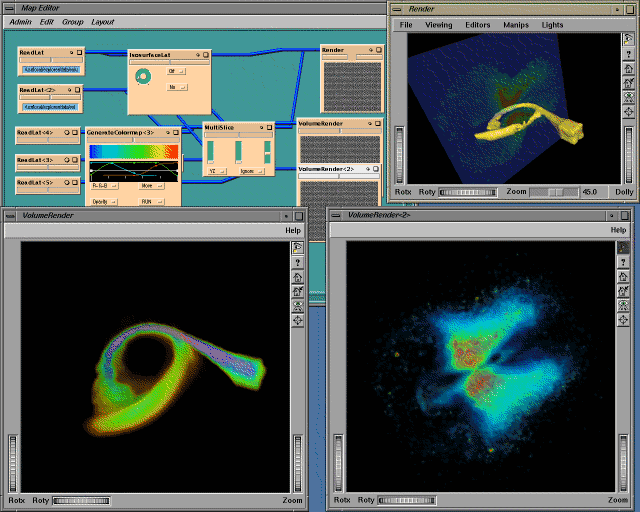
A hydrodynamics simulation created in Explorer, an application used for visualizing data. Inventor is used for the 3D rendering module. (Data courtesy of Drew Whitehouse and Gustav Meglicki, Australian National University Supercomputer Facility. Image by Roy Hashimoto.)
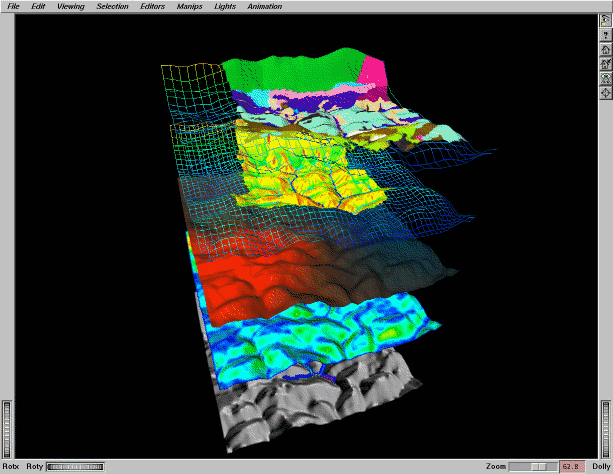
Five map layers showing the Mahantango Creek USDA Watershed in Pennsylvania. The layers show direction of steepest descent, slope, rainfall, soil saturation, and soil category. (Data courtesy of Dominique Thongs, Department of Civil Engineering; image courtesy of Interactive Computer Graphics Laboratory, Princeton University.)
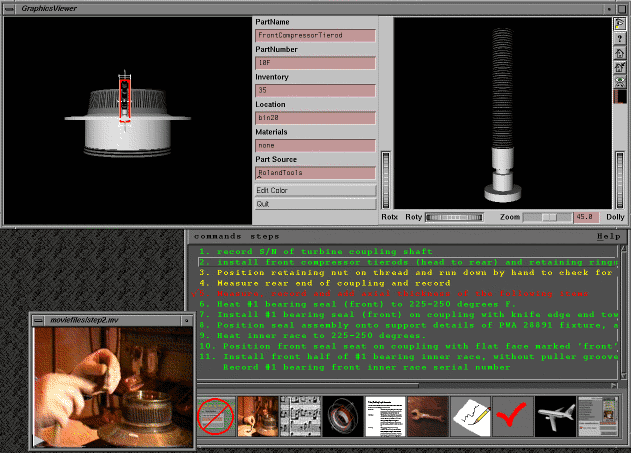
A multimedia repair manual and inventory database. The user can move the displayed object, zoom in on selected parts, view demonstration videos, and listen to voice annotations. (Image by Kevin Goldsmith.)
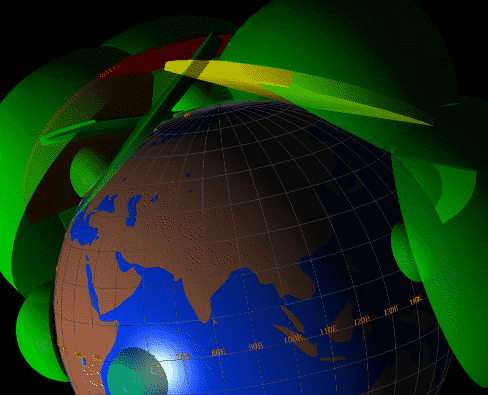
An application displaying radar coverage and status in 3D. Two new shape classes are used: a dome shape representing movable antenna radars and a pie shape representing phased-array radars. (Image courtesy of Decision-Science Applications, Inc.)
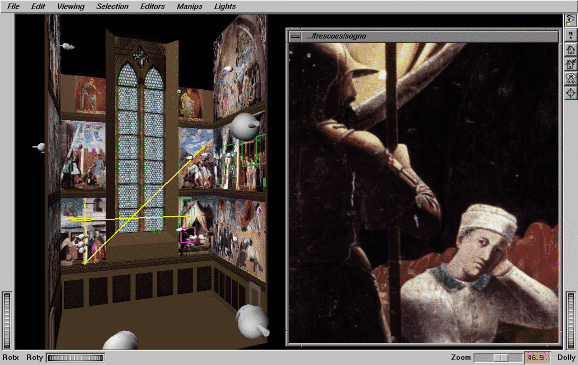
The Piero Project, an application for teaching art history using interactive 3D computer graphics. This image shows a reconstruction of the Church of San Francesco in Arezzo, Italy. Clicking on the pink box brings up the higher resolution image shown at right. Clicking on a white sphere allows the user to view the scene from that position. White spheres can be connected to create an animated tour of the church. (Image courtesy of Interactive Computer Graphics Laboratory, Princeton University, and The Piero Project by Kirk Alexander, Kevin Perry, and Marilyn Aronberg Lavin.)
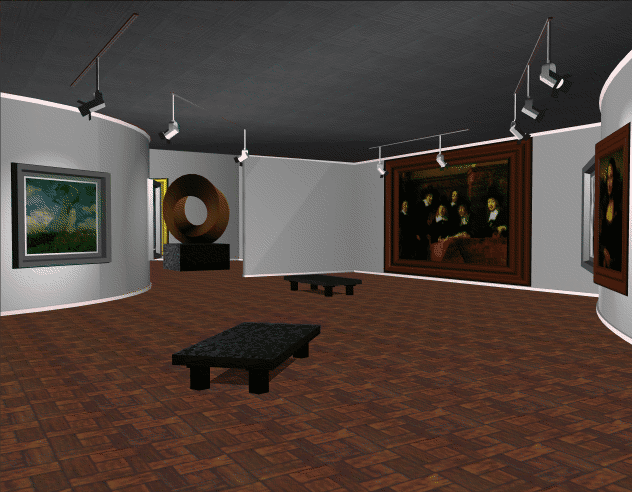
An interactive art gallery tour. (Image by Gavin Bell and Kevin Goldsmith.)
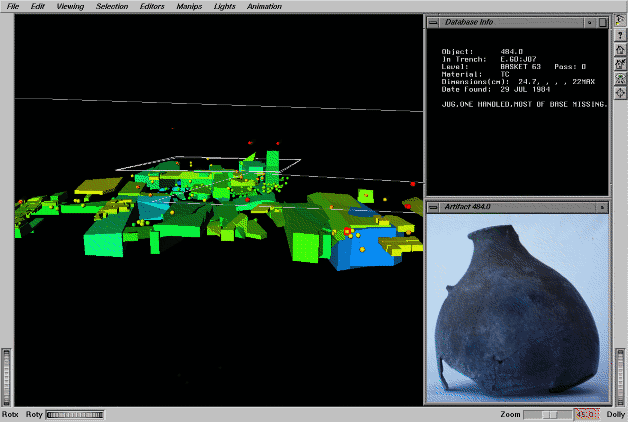
Trenchmaster, an archaeological application. The main window contains shapes representing artifacts found in an excavation trench. Clicking on a shape brings up additional windows with text and photos. (Data courtesy of William Childs, Dept. of Art and Archaeology; image courtesy of Interactive Computer Graphics Laboratory, Princeton Univ.)
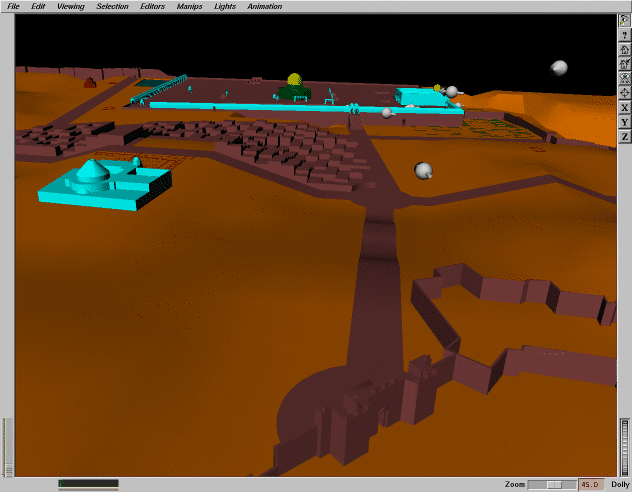
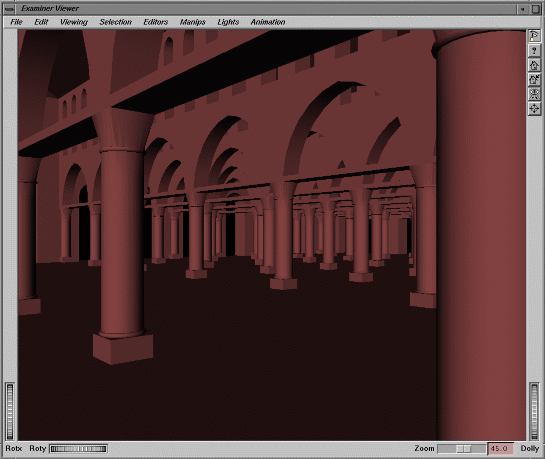
A reconstruction of early Islamic Jerusalem. The user can explore the city streets and then walk through the buildings. (Data for Plates 32 and 33 courtesy of Mohamed Alasad and Oleg Grabar, Institute for Advanced Study, Princeton, New Jersey.)
View inside a mosque, one of the buildings shown in Plate 32. (Images for Plates 32 and 33 courtesy of Interactive Computer Graphics Laboratory, Princeton Univ.)
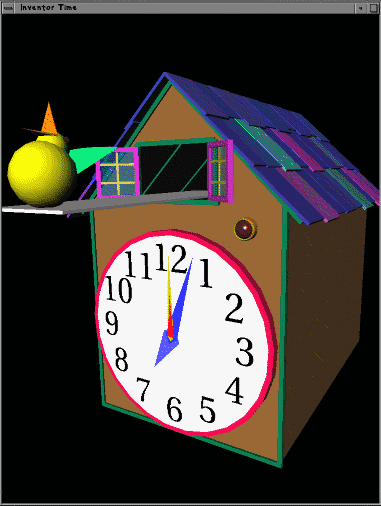
Cuckoo clock. An engine connected to the real-time global field moves the hands of the clock. (Image by Rikk Carey.)
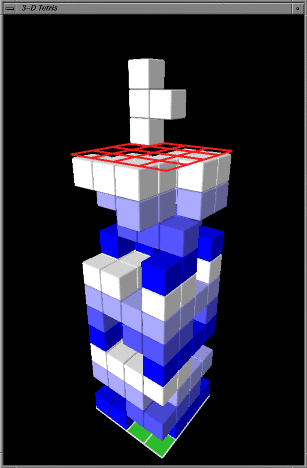
Tetris. A timer sensor animates the falling pieces. (Image by David Immel.)
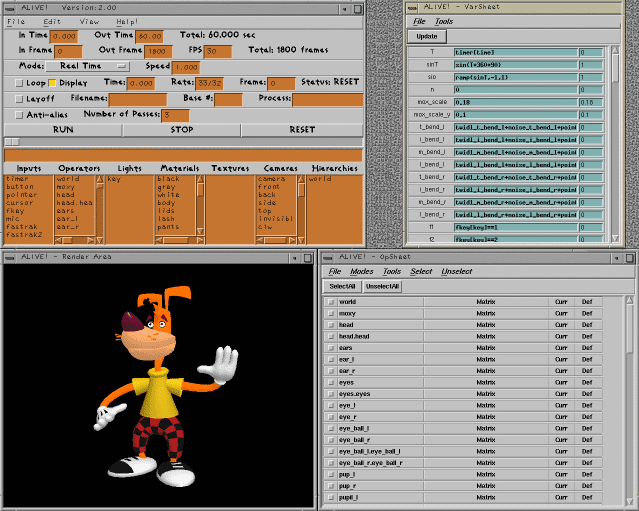
Moxy Moto, a computer-generated character created using Alive, a real-time character animation program based on Inventor. (Moxy was created by (Colossal) Pictures and by the Cartoon Network. Alive is a product of deGraf/Associates.)
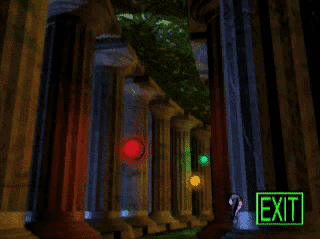
Scenes from the Out-of-Box Experience, an immersive multimedia presentation. This application adds multimedia nodes to the toolkit and the ability to synchronize Inventor objects with them. Clicking on one of the moving spheres sends the user to a new “room.”
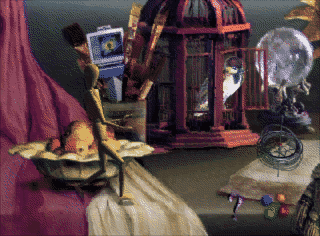
The Animations Room. Each animated object is surrounded by an invisible Inventor shape. When the user clicks on an object, a movie is played.
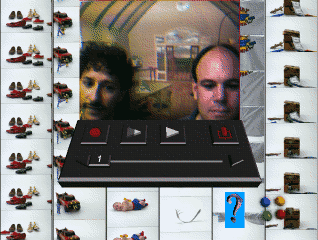
A live video window within the Stop-Motion Room. The control panel and background are built with Inventor objects.
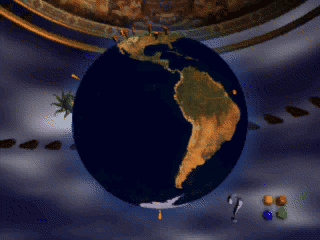
The Earth Room. The user controls the spinning of the earth within its painted galaxy. When the user clicks on a pin on the globe, a video or audio clip for that geographical area is played. (Images by Kevin Goldsmith and (Colossal) Pictures.)
