|
Open Inventor Release 2024.2.3
|
|

| |
|
Open Inventor Release 2024.2.3
|
|
|
| |
3DdataMaster defines extension nodes to Open Inventor primarily for the development of scientific visualizations. Before going any further it is very important to have read What You Must Know about MeshViz XLM:.
Important note:
All mesh types are derived from the PbMesh basic type. A mesh definition is basically given by a set of value sets. The following methods are used to initialize the meshes. The addValuesSet() method allows you to add a set of values to your mesh; removeValuesSet() or removeAllValuesSet() allows you to remove one or all of the sets. The getNumValuesSet() method returns the number of value sets associated with a mesh; getMinValuesSet() and getMaxValuesSet() return the minimum and the maximum values for a given set. For example, a value set may be the list of temperatures for each node of your mesh, or a list of pressures for each cell of your mesh. The setGeometry() method is defined for each of the basic types and allows you to initialize the node coordinates of your mesh. Please refer to PbMesh and its derived classes for a full description of these methods.
To visualize data from a mesh, you must instantiate a class derived from PoMesh , depending on the type of visualization you need. For example PoMeshSkin allows you to visualize the skin of a volume mesh. These classes are derived from Open Inventor node kits and we call them “visualization node kits.”
As a visualization node kit depends, of course, on the data describing the mesh, you must also define a relationship between the PoMesh instance and the PbMesh instance. MeshViz provides two ways to specify this relation:
, which is an Open Inventor node containing an Open Inventor field derived from PoSFMesh , itself containing an instance derived from PbMesh . Then you must add this property mesh node to the scene graph so that it will be inherited during traversal and used by the different visualization node kits you define. The methods setGeometry() and addValuesSet() are also available in the subclasses of PoMeshProperty class and build for you the instance of the contained PbMesh object.
 See also the the section called “Property and Visualization Classes”.
+ As a mesh object can contain several data sets, the visualization
 node kit can select one by using **PoMesh::valuesIndex** to color the shape in the node kit. For a 2D mesh
 representation, you can also use **PoMesh2D::zValuesIndex** to specify an elevation at each mesh node.
The PoMesh::coloringType field of the visualization node allows you to select the type of coloring that will be applied if necessary (refer to the following the section called “Surface Meshes”, for the explanation of these coloring methods). If data mapping coloringType is not COLOR_INHERITED, a data mapping object must be created to specify the data-to-color mapping, and if coloringType equals COLOR_CONTOURING or COLOR_TEXTURE_CONTOURING, an isovalueList object must be created to specify the list of isovalues. A data mapping object is defined by an instance of either the class PbDataMapping or the class PoDataMapping. An isovalueList object is defined by an instance either of the class PbIsovaluesList or the class PoIsovaluesList. (Refer to the section called “Data-to-Color Mapping” and the section called “Defining Isovalues”).
 When coloring a value set that has its values located at a cell (see the section called “Location of values”), the cells are always colored with a unique color even when the color type
(coloringType field) is COLOR_AVERAGE, COLOR_MAPPING,
COLOR_CONTOURING, or COLOR_TEXTURE_CONTOURING.
The following code fragments define the objects necessary to visualize the skin and a cross-section of a volume mesh. This example uses the Pb[xxx]objects and the PoMesh::set[xxx](Pb[xxx] *pb) methods.
Example : Visualize a skin and a cross-section of a volume mesh
Example : Uses the Po property nodes included in the scene graph
The values of a mesh can be located either at the cells of the mesh or at the nodes of the mesh.
Values at cells:
When the values are located at a cell, each cell is drawn with only one color. For instance when drawing a cross-section, the shape used to draw the intersection between the plane and a cell is colored with one color. When drawing the skin of a mesh, the face of a cell that “belongs” to the skin is also colored with one color. The color used depends on the value of this cell.
 At this time, value sets with per-cell data can only be used by the
classes PoMeshLevelSurf, PoMeshSkin, and PoMeshCrossSection.
To define a value set with values located at the cells of the mesh, use the following method:
Values at nodes:
When the values are located at the nodes of the mesh, each cell is drawn using the values of each node of the cell. How these nodes’ values are used to draw the cell depends on the coloring mode. (see the section called “Mesh coloring”).
To define a values set located at node, use the following method:
Filtering cells is a way to specify which cells are used to build the mesh representation. A cell filter is based only on the method acceptCell() of the class PoCellFilter . When acceptCell() returns TRUE, the cell given as the argument is used for the representation, otherwise the cell is not taken into account by the representation.
A cell filter does not apply any transparency to a rejected cell. When a cell is not accepted, it is as if the mesh did not contain this cell. A transparency applied to a cell of mesh skin would create a hole in the surface, whereas the cell filter actually modifies the geometry of the skin.
In order to define a custom cell filter, you must create a class derived from PoCellFilter and implement the method acceptCell() per your needs. It has two arguments, the index of the cell, and the float value at this cell. This allows you to filter the cell based on its index or a property at this cell. For instance, a filter could eliminate all cells having a value greater than a specified value, or eliminate the last 100 cells of the mesh.
The value passed as the second argument to acceptCell() is an element of the scalar data set currently selected by the representation. This data set is selected by setting the field PoMesh::valuesIndexForCellFilter.
The class PoIntervalCellFilter is a predefined implementation of a cell filter. It implements the acceptCell() method by simply checking if the value of a cell is between a given min and max range.
Example : Visualize a skin using a cell filter based on the float value at the cell The filter rejects each cell whose value (here property_for_filter) is not between 100 and 200.
In this example, the skin building process calls acceptCell() like this:
For each index of cell (cell_index) {
if acceptCell (cell_index, property_for_filter[cell_index]) is true
then include this cell in the skin
}
If valuesIndexForCellFilter is -1 or if there is no data set corresponding to the specified index, acceptCell() is called with 0 as its second argument.
PoMeshSkin, PoMeshCrossSection, PoMeshLevelSurf,PoMeshCrossContour, PoMeshSkeleton, PoMeshProbePoint, PoBaseStreamLine (and derived classes), as well as PoMesh3DVecCrossSection, use the cell filter (PoCellFilter) inherited from the scene graph.
3DdataMaster provides the following types to deal with your 2D and 3D surface meshes (the indentation shows class derivations):
To draw contour lines on your mesh with or without annotations. You can define main and sub lines. Only main lines will be annotated and you can then customize the annotation. For example, if you want them to be included in the contour line with or without a background, you can ask 3DdataMaster to clip the line around the bounding box of the annotation string, you can also force all the annotations to either be horizontal, or vertical or following the line slope, etc. The “contouring-values” (see the section called “Defining Isovalues”) are defined by the connected PbIsovaluesList object or the PoIsovaluesList object inherited during traversal.

To draw vectors field on a 2D Mesh. Figure 2.49. Surface mesh representation node classes
3DdataMaster provides the following basic types to deal with your 3D volume meshes (indentation shows class derivation):
This class defines a cross-section of the 3D volume and then builds solid contouring visualization on this plane using the current data-color mapping method.

This class builds the intersection between a cross-section of the mesh and its skin. This contour intersection can be colored using the current data-color mapping method. This representation can be useful for visualizing the position of a cross-section. The following image shows a transparent skin and a cross-contour made of two contours.

This class draws a 3D skeleton of the 3D mesh by building a set of X, Y and Z plane cross contours. The following image shows a transparent skin and a skeleton made of two X-contours, two Y-contours, and two Z-contours.

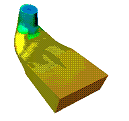
This class builds a 3D isosurface. The color of this 3D surface is specified by the current color associated with the surface value. The following image shows a transparent skin and a colored level surface. In this example, two scalar data sets are used to build the level surface. The first one defines the geometry of the level surface and the other one the coloration. The coloration is done using the current “value-to-color mapping” (see the section called “Data-to-Color Mapping”).

This class builds a vector field on a volume mesh. Each vector of the vector data set is taken into account to build the representation. The set of vector data is selected by the field PoMesh::vecsIndex.

This class builds a vector field on a cross-section of a volume mesh. A vector is drawn at each of the edges intersecting the cross-section. The value and direction of a vector is computed by linear interpolation between the two nodes of the edge intersecting the cross-section. The set of vector data is selected by the field PoMesh::vecsIndex.
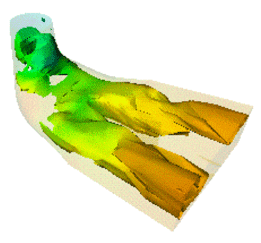
This class builds a vector field on a regular grid mapped onto a cross-section of a volume mesh. The vector at a point P of the grid is interpolated using the vectors at the nodes of the cell that contains P. This class is derived from PoMesh3DVecCrossSection and may be much more time consuming when choosing a very small grid spacing. For each point of the grid, this class uses a probe tool to find out which cell contains the point. This class behaves like PoMesh3DVecCrossSection if the grid spacing is null. The following image shows a transparent skin, a cross contour, and a vector field representation mapped onto the same plane as the cross-contour.
 Figure 2.51. Volume mesh representation node classes
The following visualization nodes may apply to surface or volume meshes (indentation shows class derivation):
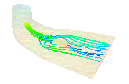
Visualization of a surface that connects several streamlines starting from a list of aligned sources. The following image represents a transparent skin and a stream-surface colored according to the velocity at the points of the surface.

Abstract class that allows animation of particles along a list of streamlines. Of course, the velocity of the particle motion is relative to the velocity on the streamlines. This class allows some control over the animation. For example, you can specify a time step, the number of frames in the animation, etc.
+ PoStreamTadpoleMotion Visualization of animated particles that look like a “tadpole.” Each particle is drawn with a line segment of three points. The length of the segment is proportional to the velocity. 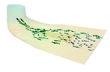 + PoStreamLineMotion Visualization of animated particles along streamlines. Each streamline is drawn with one color but some points of it are drawn with another color. This other color moves along the streamline, and so does the animation.  + PoStreamPointMotion Visualization of animated particles. Each particle is represented by a simple point. 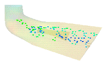 + PoStreamSphereMotion Visualization of animated particles. Each particle is represented by a sphere. The animation of these spheres can be slow. 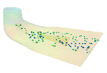
Abstract class to visualize a cell of a mesh. It can be useful for seeing some details of the geometry of a mesh, especially on a non-structured mesh. The cell to draw is specified by its index in the mesh. Note that the cell to draw can be determined by a callback triggered by the probe class PoMeshProbePoint.
* PoCellEdges

Visualization of the edges of a cell.
* PoCellFacets

Visualization of the facets of a cell. For a surface cell, it only fills
 the cell; for a volume cell, it fills the skin of the cell.
* PoCellIndices

Visualization of 2D text strings that indicate the index of the cell
 (drawn at center of the cell) and the indices of each node of the cell (drawn near each node
 position).
Class that does not draw anything, but triggers four kinds of callbacks depending on changes to its position field. Each callback passes the cell that contains the position as parameter argument. The first callback is triggered each time the probe leaves the mesh (position is out of the mesh, and it was inside before). The second callback is triggered each time the probe enters the mesh (position is inside the mesh and was out before). The third callback is triggered each time the probe moves to a different cell (position was in another cell before). The last callback is triggered each time the position changes. It can be very useful to connect the position field to an Open Inventor dragger. Figure 2.52. Common mesh representation node classes
MeshViz includes the following property classes which allow you to map a floating value to a color, or to map a set of floating values to a color ramp or several color ramps. Two ways are available to define a data-to-color mapping:
See also the the section called “Property and Visualization Classes”, PoDataMapping or PbDataMapping
.
Two values, value1 and value2, are associated with color1 and color2, and transparency1 and transparency2, respectively. The color associated with a value between value1 and value2 is a linear interpolation between color1 and color2. In the same way, the associated transparency is a linear interpolation between transparency1 and transparency2. For instance, the following lines define the color-data mapping below:
Example : Defining a linear data mapping 
Using the setColorFunction() method, you provide a function that returns an SbColor, given a floating value as an input parameter. Each time MeshViz needs to map a floating value to a color, it will call this function. In the same way, the setTransparencyFunction() method provides a function that returns a transparency, given a floating value as an input parameter. Each time MeshViz needs to map a floating value to a transparency, it will call this function.
This class defines a set of colors or a set of color ramps associated with floating values. You can choose:
+ LINEAR_PER_LEVEL type of mapping for a floating value **f**. If **f** is in the interval
 **f** i, **f** i+1, its associated color will be the linear
 interpolation between **c** i and **c** i+1 RGB or HLS colors. In this case, you must
 provide the same number of floating values as the number of colors.
+ NON_LINEAR_PER_LEVEL type of mapping for a floating value **f**. If **f** is in the interval
 **f** i, **f** i+1, its associated color will be the **c** i+1 th RGB or HLS color; no interpolation is
 performed. If **f** is smaller than **f** 1, then **c** 1 is used. In this case, you must provide n+1
 colors for n floating values.
Example : Defining a data mapping with several colors 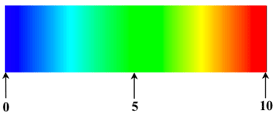
```
float values[5] = {0.0, 2.5, 5., 7.5, 10.}; SbColor colors[5] = { SbColor(0.0,0.0,1.0), SbColor(0.0,1.0,1.0), SbColor(0.0,1.,0.), SbColor(1.0,1.0,0.0), SbColor(1.0,0.0,0.0) }; PoNonLinearDataMapping2 *myDataMapping = new PoNonLinearDataMapping2; myDataMapping->color.setValues(0,5,colors); myDataMapping->value.setValues(0,5,values); myDataMapping->type = PoNonLinearDataMapping2::LINEAR_PER_LEVEL;
``` The data mapping nodes also allow you to specify threshold values associated with colors. You can specify a minimum threshold or a maximum one using PoDataMapping::minThreshold and PoDataMapping::maxThreshold fields. All values smaller than the minimum threshold are associated with the specified color and, in the same way, values greater than the maximum threshold will be associated with the color of this maximum value.
The threshold effect can be activated and deactivated using the PoDataMapping::maxThresholdEnabled and PoDataMapping::minThresholdEnabled fields.
Sometime it can be useful to visualize meshes that contain some nodes which have a very large or very small value compared to the range of the other nodes values. It can be nodes where no calculation, measurement, or probe has been realized. It can be a way to indicate that the scalar value at a node is not assigned, or is not significant for visualization. In the following discussion, we call these special values “undefined values.”
MeshViz provides two ways of handling theses undefined values using the PoDataMapping nodes (or PbDataMapping ):
To summarize, a value V is undefined in the following cases:
To visualize an undefined value with a specific transparency, just assign the fields:
PoDataMapping::maxThresholdTransparency or PoDataMapping::minThresholdTransparency, and assign the field transparencyEnabled to TRUE.
If you want to discard from the scene graph each cell or shape that
contains an undefined value, set these transparencies to a full value, i.e. a value greater
than PoDataMapping::transparencyValueDeletedParts(0.95 by default).
 The following example (located in $OIVHOME/src/MeshViz/Mentor) visualizes a rectangular mesh; each cell that contains one or more undefined nodes will be discarded.
Example : A rectangular mesh with undefined values
 To visualize undefined cells in gray, just replace the two lines:
by:
If you want to do solid or line contouring, you must specify which values you want to display. MeshViz provides the PbIsovaluesList and PoIsovaluesList classes that allow you to do so. There are two ways to define a list of isovalues:
See also the the section called “Property and Visualization Classes” A list of isovalues can be a list of any floats. However, convenience methods are available to define a regular list. In a regular list, the step size between two consecutive isovalues is a constant. For example, the following methods are available for creating lists:
Example : Creates a regular list of 25 isovalues bounded by 0 and 10
or:
:_0_8_12 Example : Defines a non-regular list that contains three isovalues: 0 8 12
or:
The isovalue list may be used by the following visualization
nodes:* PoMeshContouring to visualize isolines of a mesh.