Class SoGrayscaleCorrelationProcessing2d
- java.lang.Object
-
- com.openinventor.inventor.Inventor
-
- com.openinventor.inventor.misc.SoBase
-
- com.openinventor.inventor.fields.SoFieldContainer
-
- com.openinventor.inventor.engines.SoEngine
-
- com.openinventor.imageviz.engines.SoImageVizEngine
-
- com.openinventor.imageviz.engines.geometryandmatching.patternrecognition.SoGrayscaleCorrelationProcessing2d
-
- All Implemented Interfaces:
SafeDisposable
public class SoGrayscaleCorrelationProcessing2d
extends SoImageVizEngine
SoGrayscaleCorrelationProcessing2dengine. TheSoGrayscaleCorrelationProcessing2dimage filter performs a correlation between a grey level image I and a grey level kernel K returning the correlation image O.See Correlation for generalities.
Notations:


The different possibilities are presented below using a 1-D correlation between an image and kernel. In the image, the kernel appears 6 times with different contrast and luminosity.
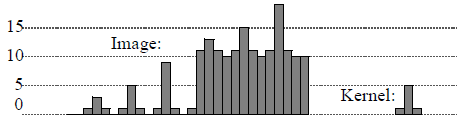 The 6 examples show the kernel appearing with different contrast and luminosity.
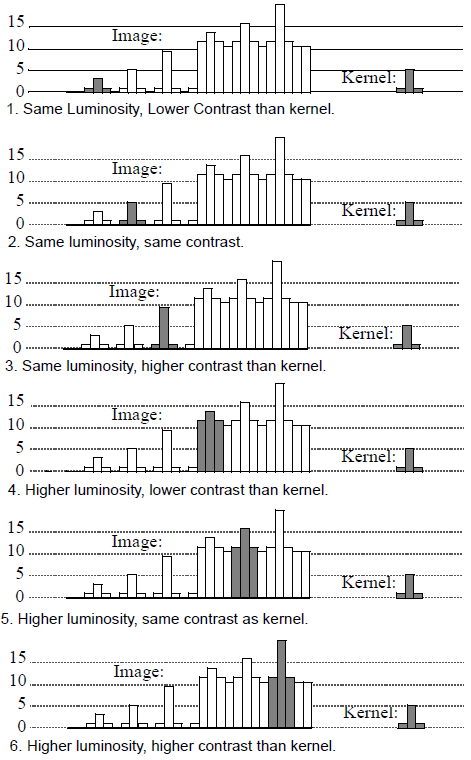
Multiply correlation The correlation is performed depending on
SoGrayscaleCorrelationProcessing2d.CorrelationMode.For DIRECT  In this mode, we have detected 3 of the 6 patterns matching the kernel. Only high luminosity patterns have been detected. The best matching is obtained for the high contrast and luminosity pattern.
For MEAN  In this mode, we have detected 2 of the 6 patterns matching the kernel. Only high contrast patterns have been detected. The confidence rate is the same for the two 2 patterns.
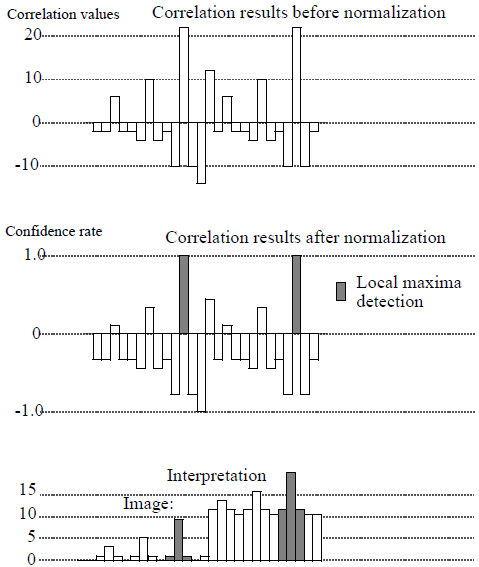
For VARIANCE  In this mode, we have detected the 2 patterns matching the kernel with the same confidence rate.
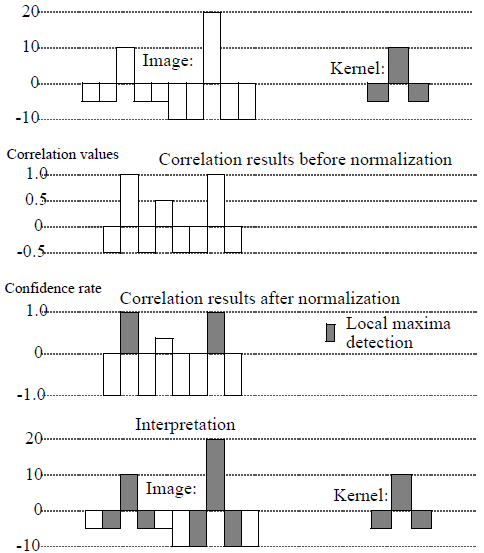
For MEAN_VARIANCE  In this mode, we have detected the 6 patterns matching the kernel with the same confidence rate.
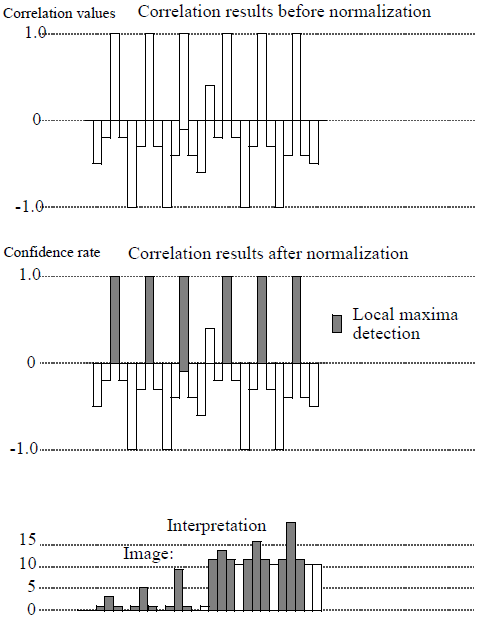
Difference correlation The correlation is performed depending on
SoGrayscaleCorrelationProcessing2d.CorrelationMode.For DIRECT  In this mode, we have detected 3 of the 6 patterns matching the kernel. Only similar luminosity patterns have been detected. The best matching is obtained with the similar contrast and luminosity pattern.
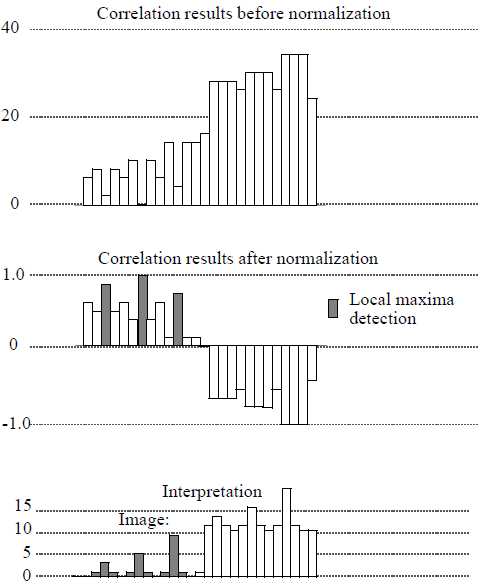
For MEAN  In this mode, we have detected 2 of the 6 patterns matching the kernel. Only similar contrast patterns have been detected. The confidence rate is the same for the 2 patterns.
For VARIANCE  In this mode, we have detected 3 of the 6 patterns matching the kernel. Only similar luminosity patterns have been detected. The confidence rate is the same for the 3 patterns.
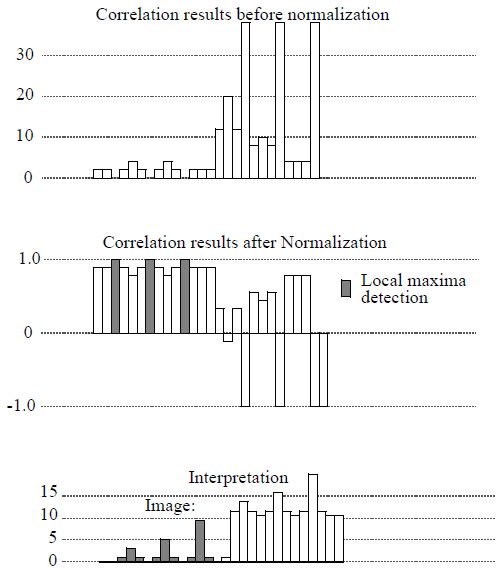
For MEAN_VARIANCE  In this mode, we have detected the 6 patterns matching the kernel with the same confidence rate.
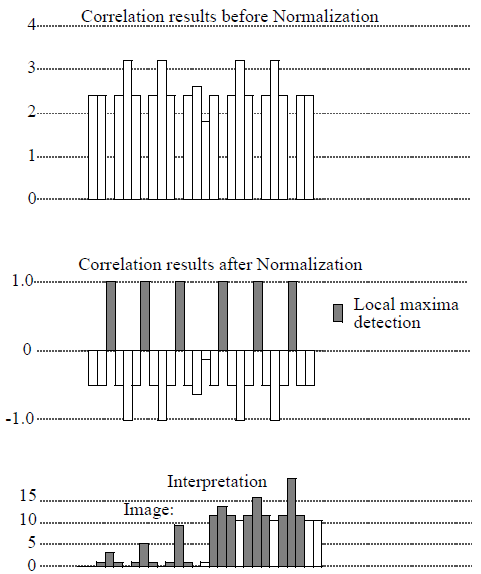
Sign Change correlation The correlation is performed depending on
SoGrayscaleCorrelationProcessing2d.CorrelationMode. is the sign change criterion performed on the difference image. It corresponds to the number of sign changes calculated on every line.
 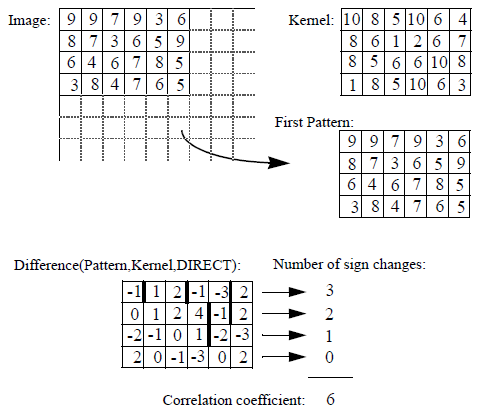 The object in the model and the object in the image have luminosity, contrast and noise differences. After normalization depending on the correlation type, the sign change criterion is applied on the difference image. The noise is supposed to be additive and zero mean. The statistical density function of the noise is supposed to be symmetrical. The best matching will correspond to the maximum number of sign changes.
This correlation gives very good results with big kernels. It was created for medical applications where images are often very noisy.
For DIRECT 
For MEAN 
For VARIANCE 
For MEAN_VARIANCE 
File format/default:
GrayscaleCorrelationProcessing2d {
correlationCriterion MULTIPLY inGrayImage NULL inKernelImage NULL offsetMode OFFSET_1 correlationMode DIRECT
Library references: dcorrel mcorrel scorrel
-
-
Nested Class Summary
Nested Classes Modifier and Type Class Description static classSoGrayscaleCorrelationProcessing2d.CorrelationCriterionsSee Correlation.static classSoGrayscaleCorrelationProcessing2d.CorrelationModesSee Correlation and for eachSoGrayscaleCorrelationProcessing2d.CorrelationCriterion.static classSoGrayscaleCorrelationProcessing2d.OffsetModesThis field is ignored in the multiply correlation mode.static classSoGrayscaleCorrelationProcessing2d.SbCorrelationDetailResults details of image correlation.-
Nested classes/interfaces inherited from class com.openinventor.imageviz.engines.SoImageVizEngine
SoImageVizEngine.ComputeModes, SoImageVizEngine.EventArg, SoImageVizEngine.Neighborhood3ds
-
Nested classes/interfaces inherited from class com.openinventor.inventor.Inventor
Inventor.ConstructorCommand
-
-
Field Summary
Fields Modifier and Type Field Description SoSFEnum<SoGrayscaleCorrelationProcessing2d.CorrelationCriterions>correlationCriterionSelect the correlation operator.SoSFEnum<SoGrayscaleCorrelationProcessing2d.CorrelationModes>correlationModeSelect the normalization mode for correlation.SoSFImageDataAdapterinGrayImageThe input grayscale image.SoSFImageDataAdapterinKernelImageThe correlation kernel.SoSFEnum<SoGrayscaleCorrelationProcessing2d.OffsetModes>offsetModeSelect the calculation offset (number of pixels).SoImageVizEngineOutput<SoSFImageDataAdapter,SoImageDataAdapter>outMatchingImageThe output correlation image.SoImageVizEngineAnalysisOutput<SoGrayscaleCorrelationProcessing2d.SbCorrelationDetail>outResultThe correlation matching results.-
Fields inherited from class com.openinventor.imageviz.engines.SoImageVizEngine
onBegin, onEnd, onProgress
-
Fields inherited from class com.openinventor.inventor.Inventor
VERBOSE_LEVEL, ZeroHandle
-
-
Constructor Summary
Constructors Constructor Description SoGrayscaleCorrelationProcessing2d()Constructor.
-
Method Summary
-
Methods inherited from class com.openinventor.imageviz.engines.SoImageVizEngine
abortEvaluate, isEvaluating, startEvaluate, waitEvaluate
-
Methods inherited from class com.openinventor.inventor.engines.SoEngine
copy, getByName, getOutput, getOutputName
-
Methods inherited from class com.openinventor.inventor.fields.SoFieldContainer
copyFieldValues, copyFieldValues, enableNotify, fieldsAreEqual, get, getAllFields, getEventIn, getEventOut, getField, getFieldName, hasDefaultValues, isNotifyEnabled, set, setToDefaults
-
Methods inherited from class com.openinventor.inventor.misc.SoBase
dispose, getName, isDisposable, isSynchronizable, setName, setSynchronizable, touch
-
Methods inherited from class com.openinventor.inventor.Inventor
getNativeResourceHandle
-
-
-
-
Field Detail
-
correlationCriterion
public final SoSFEnum<SoGrayscaleCorrelationProcessing2d.CorrelationCriterions> correlationCriterion
Select the correlation operator. . Default is MULTIPLY
-
inGrayImage
public final SoSFImageDataAdapter inGrayImage
The input grayscale image. Default value is NULL. Supported types include: grayscale binary label image.
-
inKernelImage
public final SoSFImageDataAdapter inKernelImage
The correlation kernel. Default value is NULL. Supported types include: grayscale binary label image.
-
offsetMode
public final SoSFEnum<SoGrayscaleCorrelationProcessing2d.OffsetModes> offsetMode
Select the calculation offset (number of pixels). . Default is OFFSET_1
-
correlationMode
public final SoSFEnum<SoGrayscaleCorrelationProcessing2d.CorrelationModes> correlationMode
Select the normalization mode for correlation. . Default is DIRECT
-
outMatchingImage
public final SoImageVizEngineOutput<SoSFImageDataAdapter,SoImageDataAdapter> outMatchingImage
The output correlation image. Default value is NULL. Supported types include: grayscale color image.
-
outResult
public final SoImageVizEngineAnalysisOutput<SoGrayscaleCorrelationProcessing2d.SbCorrelationDetail> outResult
The correlation matching results. Default value is NULL.
-
-